Introduction
The original set o rules came from a book by John R. Hill.
They were reoffered by another vendor and sell for $100.
Long entry rules
Pivot Point Low: Lowest point in a movement prior to penetration of a daily high. Close must be above previous close on day of penetration of that high.
After pivot point, wait for penetration of that low. Go long on the close of day that:
1. Closes above two previous closes.
2. Close is above the pivot point low.
3. Close is above opening price and above the midrange of the day action.
4. This day range is greater than the previous day's range.
5. This reversal day occurs no later than six days after penetration of pivot point low.
Short Entry Rules
Exact opposite of the above. In other words, look for penetration of pivot point high and then reversal down.
Initial Stop on Long:
One tick below the extreme low after entry.
Initial Stop on Short:
One tick above extreme high after entry.
Trailing Stop:
Always move stop up to next pivot point low.
Exit Rules on Buys:(Exit Rules for Shorts are Opposite)
1. Only on execution of stop or on a sell signal.
2. After a $1000 profit or rule 1.
3. Four days after entry or rule 1.
4. Move stop to a point of entry if position is at a profit after four days and then exit via rule 1.
Sunday, September 15, 2013
Tuesday, September 10, 2013
How to diversificate properly your portfolio?
Just follow this set of rules:
1. You cannot purchase a stock that will increase a position more than 25% of your portfolio (always).
2. No one stock can exceed 25% of your portfolio assets (Majority of quarter).
3. Half of your portfolio must be made up of stocks of 10%(or less) of your portfolio assets (Majority of quarter).
And that's it!
Monday, September 09, 2013
Next cycle up?
Next cycle up? by steveoliveira on TradingView.com
Complex normally is followed by a contrarian movement.
What everyone looks for in the stock market?
Everyone
have dreams, and the majority has a crappy job or a lot of debt and Mr. Market
is there and offers you the light at the end of the tunnel. Most people can
achieve a good return on investment if pointed on the right direction, however
if a good return is something around 10 to 15% a year, then we have a problem.
How can I solve
my problems with a 15% per year on 10.000 USD of investment? 1500 USD?
So the
solution is to try to keep looking for some kind of strategy that yields you something
big. Because you know that is possible to achieve such a return. You saw Tim
Sykes, and the guy can do it, and teaches you how to get there, so can you replicate
him? I don't know that answer, I just know that for the majority of you are
going to loose time and money in the process.
The idea
that you can yield a big return from a little account that can change your life
and put you trading for a living from any part of the world seems compelling.
My advice…
Take a look
at Millionaire Traders from Kathy Lien. It’s an interesting book… See if you
identify yourself with any of the traders and good luck with the process.
Thursday, September 05, 2013
Harmonics
Now harmonics are the new trend in technical analysis. I haven´t seen this subject in my CMT exams, but i guess it will be there soon.
The big question is to know if it works, and the answer is yes and no.
We have a tendency to memorize the charts that worked and seem to forget the ones that didn't, in the end it's all a matter of money management for the people who put the trades.
There will be the whipsaws or the noise to make your life harder, it's a part of the process as in all other patterns.
In the meantime, let's enjoy.
Thanks,
S.
Some upside here... by steveoliveira on TradingView.com
Wednesday, September 04, 2013
Anatomy of a Position Trade
I want to share you how i approach a trade setup on the SPY.
First thing to do is to perform a technical analysis and identify the red zones and potential movements.
It's clear that there is a strong support around 160, which if breached will end the bull scenario, however we also have a good positive divergence on the last swing lows which are also present in some of the index components.
We have a gap at 168 that can be used as target.
So, if i wanted to play the long side, i would Buy 100 shares at 164.39 and sell a Covered Call at 168 for 0.54 cents and collect some premium.
I would also Buy 2 163 Puts and Sell 4 160 Puts for 0.98 cents, making a ratio spread.
This means that if the stock falls to 159 (at expiration), below support i will be assigned on the 2 Puts that are naked, making me long on 200 shares @ 160. However my average on this 200 shares will fell to 157 because of the profit on the long puts.
In the end i will have a position of 300 shares with an average price of 159.46 plus the premiums received on the covered calls and the ratio.
If the stock rises to 168 at expiration, i will assign and keep the profit and premiums.
Note: Options are risky and you should read Characteristics and Risks of Standardized Options and Supplements

Tuesday, September 03, 2013
When to Sell?
One
question a i get a lot is when to exit the trade. Because if you study a little
bit, you will find that it is easy to get it right when to buy, the problem
comes later when it’s time to sell.
Mr. Market
knows how to get your mind mixed up and that’s why there is this complex
movements that make you exit at the lows and enter at the highs.
That’s why I
think you need to have some sort of strategy to help you exit without making
you think a lot.
One way to
this is to plot a moving average of the lows. In the following chart you have a
3 day MA of the lows, and you can see that it helps you with the trend.

You can
tweak the indicator to get a more accurate setting of the stock in play.
However,
remember that this kind of strategy is best as a trailing stop, and that’s
because when you enter is also when there’s more volatility and the only way to
overcome the noise is to have a fixed initial stop that is in line with your
risk parameters. As the price enters in trend mode, you place your trailing strategy.
Thanks,
S.
Thanks,
S.
Monday, September 02, 2013
The importance of time during the day to daytrade
Normally i see some directional movement until 11h30 and then after 3PM.
In the between hours, normally there are very good opportunities to fade highs and lows.
Use an oscillator to help and a stock that had a recent strong daily thrust bar.
Here is an example:
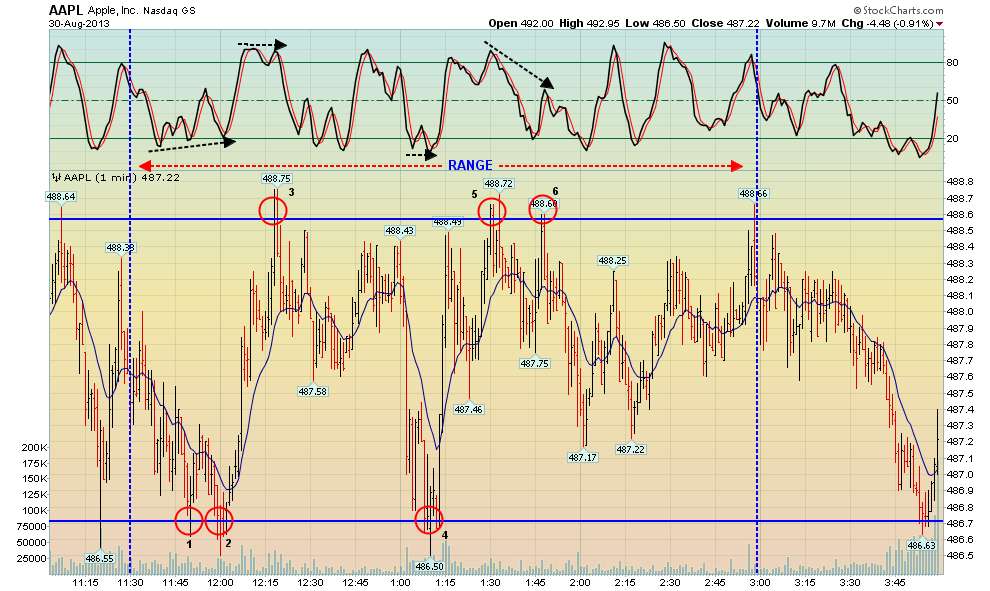
Level 2 quotes will help improving the odds of a successful entry.
Thanks,
S.
Sunday, September 01, 2013
Wedge or Ending Diagonal
If you like patterns, my advice is to look for them in higher time frames.
I found this beautiful wedge 5 months ago. It was a good trade and i want to share it with you.
Original Post:
This one shows a good ROIC (return on invested capital) which means that fundamentals support the long side, however this sector is one of the hated, but still, i see some accumulation building.
I will wait for the wegde breakout to get long, and i'll wait until the 38.2% retracement, that's a 60% upside.
I like this one a lot!
Capella Education Company by steveoliveira on TradingView.com
Subscribe to:
Posts (Atom)